Participant Characteristics
Normal-weight and obese groups are described in Table 1. We did not have complete Non-food Reward and Punishment questionnaire datasets from one obese individual and another obese individual did not undergo a PET scan. Therefore, analyzed data sets including these variables consist of 21 obese and 17 normal-weight individuals. One normal-weight participant’s midbrain D2R BPND was too low to be quantified by our processing software and analyses including this variable included 20 or 21 obese and 16 normal-weight participants.
BMI and Central D2R Specific Binding
As in our previous report on a subset of these individuals10, after covarying for age, ethinicity and education level, obese and normal-weight groups did not differ in striatal BPND (normal weight mean total striatal BPND = 10.30, S.D. = 1.17; obese mean total striatal BPND = 10.22, S.D. = 1.34; F1,33 = 1.98, p = 0.17). Across both groups, dorsal striatal D2R BPND was greater than ventral striatal BPND at a marginally significant level (dorsal mean BPND = 4.09, S.D. = 0.52; ventral mean BPND = 2.08, S.D. = 0.29; F1,33 = 3.87, p = 0.06) and there was no significant interaction between group and striatal region (F1,33 = 1.98, p = 0.17). Midbrain D2R BPND was not different between normal-weight and obese groups (normal-weight mean BPND = 0.27, S.D = 0.14; obese mean BPND = 0.27, S.D. = 0.09; F1,32 = 0.15, p = 0.70).
Controlling for age, ethnicity and education, BMI did not predict striatal BPND across all participants (dorsal R2 change = 0.07. F1,33 = 2.61, p = 0.12; ventral R2 change = 0.00. F1,33 = 0.02, p = 0.90) (Fig. 1), or within either group (normal-weight: dorsal R2 change = 0.01; F1,12 = 0.19, p = 0.67, ventral R2 change = 0.00. F1,12 = 0.002, p = 0.97; obese: dorsal R2 change = 0.03; F1,16 = 0.62, p = 0.44, ventral R2 change = 0.04; F1,16 = 0.99, p = 0.33). Similarly, BMI did not predict midbrain D2R BPND across normal-weight and obese participants (R2 change = 0.00. F1,32 = 0.001, p = 0.98) or within either group (normal-weight: R2 change = 0.05; F1,11 = 0.55, p = 0.48; obese: R2 change = 0.12; F1,16 = 2.51, p = 0.13).
Figure 1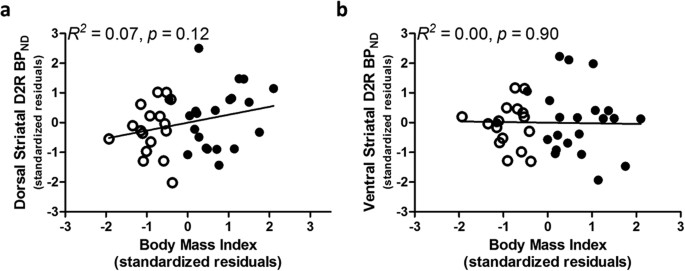
BMI and striatal D2R are not significantly correlated across normal-weight (clear circles) and obese (filled circles) groups.
D2R specific binding was not correlated with BMI in the a, dorsal or b, ventral striatum. Data points are standardized residuals of partial correlations after covarying for age, ethnicity and education level. BPND, dopamine D2 receptor binding potential.
Obesity-associated Behavior
Table 2 presents group mean (S.D.) summed z-scores for each domain and raw scores for each questionnaire.
The obese group had higher mean domain scores on Eating Related to Emotion (F1,34 = 11.62, p Fig. 2A) and Eating Related to Reward (F1,34 = 28.47, p Fig. 2B) and a lower mean domain score on Non-food Reward (F1,33 = 5.37, p = 0.03; Fig. 2C). Punishment domain scores were higher in obese relative to normal-weight at a marginally significant level (F1,33 = 3.69, p = 0.06; Fig. 2D).
Figure 2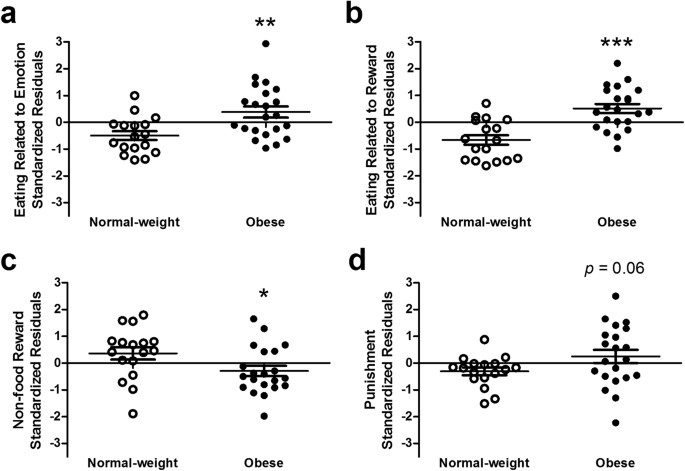
Behaviors thought to be tightly coupled to dopamine signaling differ between normal-weight and obese individuals.
Obese individuals self-report higher rates of a, emotion- and b, reward-based eating behavior, c, lower rates of non-food reward behavior and d, higher rates of avoidance of punishment relative to normal-weight individuals. Data points are standardized residuals of partial correlations after controlling for age, ethnicity and education level. *, **, ***, p ≤ 0.05, 0.01, 0.001 relative to normal-weight. For avoidance of punishment, p = 0.06 relative to normal-weight.
Within the Eating Related to Emotion domain, scores on all three questionnaires were correlated with each other (0.63 ≤ r39 ≤ 0.80, p F1,33 = 6.42, p = 0.02) and DEBQ ES (F1,33 = 4.75, p = 0.04) and marginally significantly higher on STQ MAE (F1,33 = 3.48, p = 0.07). BMI was associated with the summed domain score across the entire sample (r39 = 0.46, p r22 = −0.24, p = 0.29) or normal-weight (r17 = 0.09, p = 0.74).
The z-scores on the three questionnaires included in the Eating Related to Reward domain were correlated with each other (r39 = 0.43, p ≤ 0.01). The obese group scored higher on the BES (F1,34 = 19.57, p F1,34 = 14.77, p = 0.001) and the FCI (F1,34 = 10.35, p = 0.003). BMI related to the summed domain score in the entire sample (r39 = 0.37, p 0.02) but not within obese (r22 = 0.07, p = 0.78) or normal-weight (r17 = −0.03, p = 0.91).
Within the Non-food Reward domain, the individual questionnaires did not correlate (0.03 ≤ r38 ≤ 0.28, p ≥ 0.09). The obese group had a lower mean score than the normal-weight group on the behavioral approach subscale of the BIS/BAS (F1,33 = 6.47, p = 0.02). Groups did not differ significantly on any of the other Reward domain scales (SPSRQ: F1,33 = 0.21, p = 0.65; TCI-R: F1,33 = 0.44, p = 0.51) except at a marginally significant level on the GRAPES reward expectancy subscale (obese F1,33 = 3.25, p = 0.08). BMI did not correlate significantly with the summed domain score in the entire sample (r38 = −0.11, p = 0.51) or within normal-weight (r17 = 0.39, p = 0.12; Fig. 3A). However, BMI was correlated with the reward summed domain score within obese (r21 = 0.54, p = 0.01; Fig. 3B).
Figure 3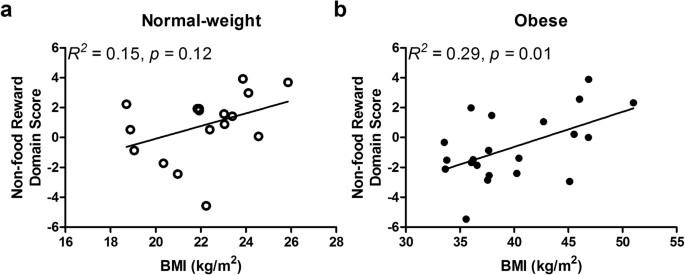
Although the obese group self-reported lower rates of non-food reward behavior relative to the normal-weight group, higher BMI was associated with higher rates of non-food reward behavior within obese individuals.
a, BMI and non-food reward behavior, a composite measure of reward-related behavior including approach, expectancy and sensitivity towards reward stimuli other than food, was not significantly associated with BMI in the normal-weight group. b, Across obese individuals, there was a positive relationship between BMI and non-food reward behavior. BMI, body mass index.
Within the Punishment domain, scores on all questionnaires were correlated with each other (0.54 ≤ r39 ≤ 0.79, p ≤ 0.001). The obese group tended to score higher on the behavioral inhibition portion of the BIS/BAS (F1,33 = 3.11, p = 0.09) and the damage avoidance subscale of the TCI-R (F1,33 = 3.17, p = 0.08) than the normal-weight group; these differences were marginally significant. Obese and normal-weight groups did not differ on the punishment expectancy subscale of the GRAPES (F1,33 = 1.10, p = 0.30) or sensitivity to punishment subscale of SPRSQ (F1,33 = 2.30, p = 0.14). BMI did not correlate significantly with the summed domain score in the entire sample (r38 = 0.15, p = 0.37) or within normal-weight (r17 = 0.21, p = 0.43) or obese (r21 = −0.35, p = 0.12) groups.
Obesity-associated Behavior and Central D2R BPND
After covarying age, ethnicity, education level and BMI, the Eating Related to Emotion domain score related to dorsal striatal BPND (R2 change = 0.13. F1,32 = 7.51, p = 0.01; partial r = 0.44; Fig. 4A) but Eating Related to Reward (R2 change = 0.02. F1,32 = 1.15, p = 0.29), Non-food Reward (R2 change = 0.01. F1,31 = 0.31, p = 0.58) and Punishment (R2 change = 0.00. F1,31 = 0.06, p = 0.81) domain scores did not. Within the Eating Related to Emotion domain, EES (R2 change = 0.08. F1,32 = 5.48, p = 0.03, partial r = 0.38), DEBQ ES (R2 change = 0.12. F1,32 = 6.88, p = 0.01, partial r = 0.42) and STQ MAE (R2 change = 0.10. F1,32 = 4.48, p = 0.04, partial r = 0.35) scores were associated with dorsal striatal BPND .
Figure 4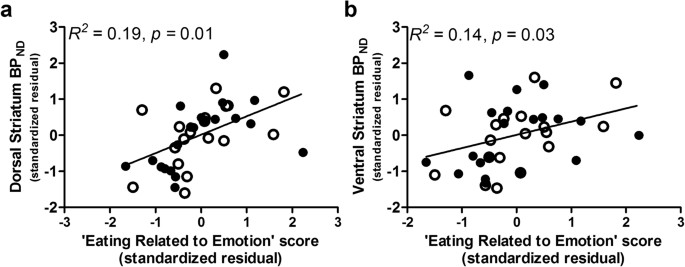
Self-reported emotional eating correlates with striatal D2R binding independent of BMI across normal-weight (clear circles) and obese (filled circles) individuals.
Higher rates of emotion-based eating, a composite measure of self-reported tendency to eat to avoid negative emotion, was related to higher a, dorsal and b, ventral striatal D2R across normal-weight and obese groups. Data points are standardized residuals of partial correlations after controlling for age, ethnicity, education level and BMI. BPND, dopamine D2 receptor binding potential.
After covarying age, ethnicity, education level and BMI, Eating Related to Emotion domain scores (R2 change = 0.11. F1,32 = 5.18, p = 0.03) related to ventral striatal BPND (Fig. 4B) but Eating Related to Reward (R2 change = 0.05. F1,32 = 2.33, p = 0.14), Non-food Reward (R2 change = 0.00. F1,31 = 0.19, p = 0.67) and Punishment (R2 change = 0.02. F1,31 = 0.72, p = 0.40) domain scores did not. Within the Eating Related to Emotion domain, DEBQ ES (R2 change = 0.10. F1,32 = 4.71, p = 0.04, partial r = 0.36) scores significantly correlated with ventral striatal BPND. STQ MAE (R2 change = 0.08. F1,32 = 3.93, p = 0.06; partial r = 0.33) and EES (R2 change = 0.07. F1,32 = 3.17, p = 0.09; partial r = 0.33) scores correlated with ventral striatal BPND at a marginally significant level.
After covarying age, ethnicity, education level and BMI, midbrain D2R BPND was related to Eating Related to Emotion domain scores (R2 change = 0.10. F1,31 = 4.88, p = 0.04; partial r = 0.37, Fig. 5A). Within this domain, higher midbrain D2R BPND significantly related to higher EES (R2 change = 0.14. F1,31 = 6.48, p = 0.02; partial r = 0.42) and DEBQ ES (R2 change = 0.09. F1,31 = 4.71, p = 0.04; partial r = 0.36) scores but was not related to STQ MAE (R2 change = 0.03. F1,31 = 1.23, p = 0.28) scores. Midbrain D2R BPND was also related to Non-food Reward domain scores (R2 change = 0.13. F1,30 = 4.82, p = 0.04; partial r = 0.37, Fig. 5B). Within the Non-food Reward domain, higher midbrain D2R BPND related to higher scores on the BAS (R2 change = 0.10. F1,30 = 3.83, p = 0.06; partial r = 0.34) and reward sensitivity subscale of the SPSRQ (R2 change = 0.09. F1,30 = 3.73, p = 0.06; partial r = 0.33) at marginally significant levels but were not associated with scores on the reward expectancy subscale of the GRAPES (R2 change = 0.01. F1,30 = 0.30, p = 0.59 ) or reward-related TCI-R scales (R2 change = 0.02. F1,30 = 0.78, p = 0.38). Midbrain D2R BPND was not associated with Eating Related to Reward (R2 change = 0.00. F1,31 = 0.01, p = 0.93) or Punishment (R2 change = 0.00. F1,3 = 0.05, p = 0.83) domain scores.
Figure 5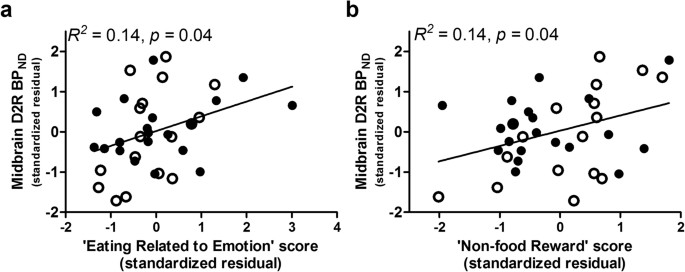
Midbrain D2R binding correlates with self-reported reward-related and eating behavior independent of BMI across normal-weight (clear circles) and obese (filled circles) individuals.
a, Higher rates of non-food reward behavior, b composite measure of self-reported tendency to approach, anticipate, and/or be sensitive to rewarding stimuli other than food, was related to higher midbrain D2R across normal-weight and obese groups. a, Similar to striatal D2R binding, midbrain D2R binding positively related to self-reported emotional eating. Data points are standardized residuals of partial correlations after controlling for age, ethnicity, education level and BMI. BPND, dopamine D2 receptor binding potential.
Voxel-based Analysis
While positive BPND-behavioral relationships appeared to be present in striatum and midbrain at less stringent criterion for statistical significance, there were no significant relationships observed between D2R binding and BMI or any of the behavioral domain scores at the voxel-wise level (p > 0.001 for all tests).

