Sample characteristics
The sample characteristics are presented at Table 1. The sample consisted mainly of females (M = 86%) in the middle ages (M = 39 years) with severe obesity (BMI M = 36.7). There were no group differences at baseline. However, the FCQ-S total score differed nearly significant between groups at T0 (p = 0.08), though it did not differ between groups at T1 (p = 0.56) and T2 (p = 0.90). This has been considered in a sensitivity analysis (see below).
Table 1 Sample characteristics of the IMPULS group (IG) and the control group (CG) at baseline (T0).
Cued exploration paradigm
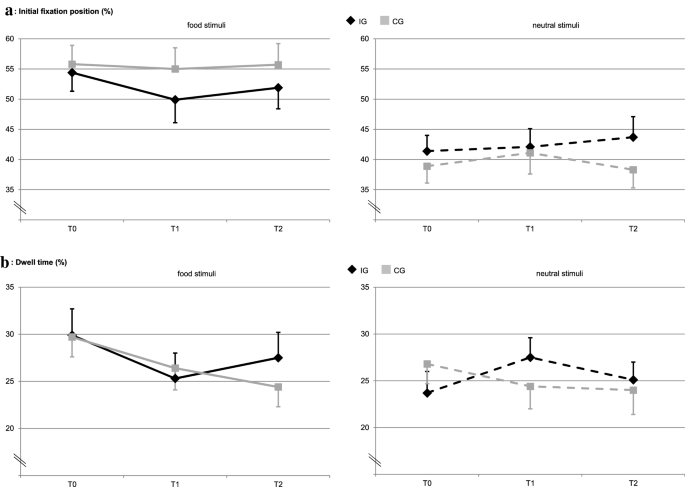
Figure 3 displays the results from the cued exploration paradigm. Concerning the initial fixation position (%), the model yielded a significant stimulus effect (overall Wald Χ2 (1) = 19.25, p Wald Χ2 (1) = 6.07, p = 0.014, B = − 13.02, CI = − 23.38 to − 2.66; CG: Wald Χ2 (1) = 12.10, p = 0.001, B = − 16.89, CI = − 26.41 to − 7.38). At T1 and T2, the stimulus differences were reduced and not significant in IG (T1: Wald Χ2 (1) = 1.82, p = 0.178; T2: Wald Χ2 (1) = 1.62, p = 0.203). The stimulus differences in CG remained significant only at T2 after Bonferroni correction (T1: Wald Χ2 (1) = 4.65, p = 0.031, B = − 13.89, CI = − 26.52 to − 1.27; T2: Wald Χ2 (1) = 9.63, p = 0.002, B = − 17.36, CI = − 28.36 to − 6.40). No other significant main or interaction effects emerged (all p > 0.05).
Figure 3
Eye tracking data of the cued exploration paradigm. Panel (a): M (SE) of the initial fixation position (%), and Panel (b): M (SE) of the dwell time (%) for food and neutral stimuli by treatment group (IG, CG) and measurement point (T0, T1, T2). Significant effects after Bonferroni correction with p (a), there is overall a significant stimulus effect with p p = .014, CG: p = .001) and at T2 in CG (p = .002). In panel (b), there was a significant three-way interaction with p = .016.
Concerning dwell time (%), overall no significant effects emerged, but a significant three-way interaction (Wald Χ2 (1) = 5.78, p = 0.016, B = 8.50, CI = 1.57 to 15.42) indicating that IG increased the dwell time on neutral stimuli from T0 to T1 in contrary to CG, whereas they did not differ in the dwell time on food stimuli. Concerning the neutral stimuli, there was a group x time interaction from T0 to T1 that was not significant after Bonferroni correction (Wald Χ2 (1) = 4.46, p = 0.035, B = 6.52, CI = 0.47 to 12.57). Further, CG decreased the dwell time on food stimuli from T0 to T2, which was also not significant after Bonferroni correction (Wald Χ2 (1) = 4.53, p = 0.033, B = 5.08, CI = 0.40 to 9.75). No other significant main or interaction effects emerged (all p > 0.05).
Modified antisaccade paradigm
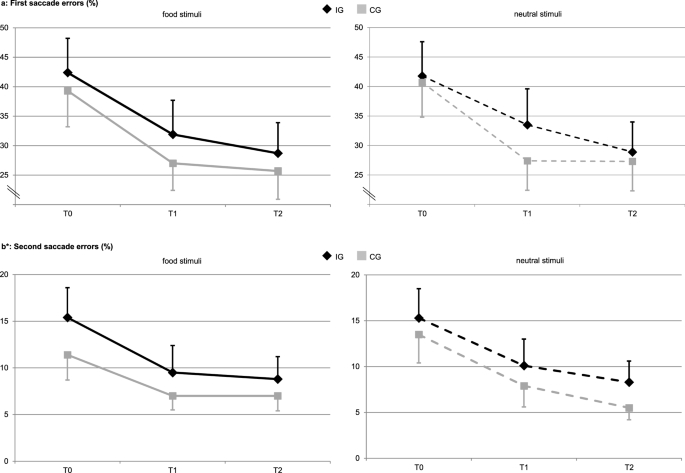
Figure 4 displays the results from the modified antisaccade paradigm. Concerning the first saccade errors (%), a significant time effect elapsed (overall Wald Χ2 (2) = 18.47, p Wald Χ2 (1) = 9.00, p = 0.003, B = − 12.73, CI = − 21.06 to − 4.42) and at T2 (Wald Χ2 (1) = 12.41, p Wald Χ2 (1) = 14.86, p Wald Χ2 (1) = 7.98, p = 0.005, B = − 12.41, CI = − 21.01 to − 3.80). For IG, this time effect was only significant at T2 (food stimuli: Wald Χ2 (1) = 7.15, p = 0.007, B = − 9.17, CI = − 15.89 to − 2.45; neutral stimuli: Wald Χ2 (1) = 7.06, p = 0.008, B = − 8.26, CI = − 14.35 to − 2.17), but not at T1 (food stimuli: Wald Χ2 (1) = 2.97, p = 0.085; neutral stimuli: Wald Χ2 (1) = 0.75, p = 0.388). There was a group x time interaction from T1 to T0 concerning neutral stimuli, indicating that CG reduced first saccade errors on neutral stimuli, but not IG. This interaction did not reach significance after Bonferroni correction (Wald Χ2 (1) = 4.10, p = 0.043, B = − 10.53, CI = − 20.72 to − 0.34). No other significant main or interaction effects occurred (all p > 0.05).
Figure 4
Eye tracking data of the modified antisaccade paradigm. Panel (a): M (SE) of the first saccade errors (%), and Panel (b): M (SE) of the second saccade errors (%) for food and neutral stimuli by treatment group (IG, CG) and measurement point (T0, T1, T2). Significant effects after Bonferroni correction with p (a), there is overall a significant time effect with p p = .007, neutral stimuli: p = .008). In CG, this effect was significant at T1 vs. T0 (food stimuli: p = .003, neutral stimuli: p p p = .005). In panel (b), there is overall a significant time effect with p p = .018, neutral stimuli: p = .015). In CG, this effect was significant for neutral stimuli at T1 vs. T0 (p = .017) and at T2 vs. T0 (p = .004). (b) displays the original values though the General Estimating Equations for the second saccade errors (%) were computed with logarithmised values to achieve normal distribution. There is a small inconsistency between (b) and the text concerning the second saccade errors (%) in IG: Measurement point T2 has a smaller mean under the food and the neutral stimuli condition as compared to measurement point T1, but only the reduction from T0 to T1 does achieve significance in the GEE model. This is due to the change to the log scale in the model. Concerning the food stimuli, this is additionally due to the change from a descriptive parameter based on unweighted observations to a model parameter derived from weighted observations with weights determined by the working correlation of the GEE model (exchangeable structure).
Concerning second saccade errors (%), there was also a significant time effect (overall Wald Χ2 (2) = 11.61, p = 0.003), indicating a reduction of second saccade errors in both groups over both measurement points. However, this time effect was only significant for the food stimuli in IG from T0 to T1 (Wald Χ2 (1) = 5.62, p = 0.018, B = − 0.226, CI = − 0.413 to − 0.039), whereas the reduction from T0 to T2 in IG failed significance (Wald Χ2 (1) = 3.11, p = 0.078). In CG, there was no significant change concerning food stimuli at both time points (T1: Wald Χ2 (1) = 1.47, p = 0.225; T2 Wald Χ2 (1) = 1.47, p = 0.225). Concerning the neutral stimuli, IG reduced second saccade errors from T0 to T1 (Wald Χ2 (1) = 5.91, p = 0.015, B = − 0.236, CI = − 0.426 to − 0.046), but not from T0 to T2 (Wald Χ2 (1) = 2.66, p = 0.103). CG reduced those errors towards neutral stimuli from T0 to T1 (Wald Χ2 (1) = 5.68, p = 0.017, B = − 0.268, CI = − 0.488 to − 0.047) and from T0 to T2 (Wald Χ2 (1) = 8.34, p = 0.004, B = − 0.339, CI = − 0.568 to − 0.109). No other significant main or interaction effects occurred (all p > 0.05).
Stimulus rating
Table 2 shows the results from the stimulus rating. Concerning the pleasantness of food stimuli, a group x time interaction (overall Wald Χ2 (1) = 6.64, p = 0.036) was not significant after Bonferroni correction, and a significant time effect elapsed (overall Wald Χ2 (2) = 15.04, p = 0.001). More precisely, the interaction was significant for T1 compared to T0 (Wald Χ2 (1) = 6.51, p = 0.011, B = 0.68, CI = 0.16 to 1.19), but not for T2 compared to T0 (Wald Χ2 (1) = 2.36, p = 0.125). The time effect was only significant in IG at both measurement points (T1: Wald Χ2 (1) = 14.63, p Wald Χ2 (1) = 16.17, p Wald Χ2 (1) = 0.36, p = 0.548; T2: Wald Χ2 (1) = 2.19, p = 0.139). These results indicate that IG perceived food as less pleasant after the treatment as compared to CG.
Table 2 Stimuli ratings (M, SE) of the food and neutral stimuli by treatment group (IG, CG) and measurement point (T0, T1, T2).
Concerning the palatability, similar results elapsed with a significant group x time interaction (overall Wald Χ2 (1) = 7.64, p = 0.022) and a significant time effect (overall Wald Χ2 (2) = 23.82, p Wald Χ2 (1) = 7.23, p = 0.007, B = 0.65, CI = 0.18 to 1.11), but not for T2 (Wald Χ2 (1) = 1.19, p = 0.275). The time effect was significant in IG at both measurement points (T1: Wald Χ2 (1) = 20.63, p Wald Χ2 (1) = 22.96, p Wald Χ2 (1) = 0.79, p = 0.375) and not at T2 compared to T0 after Bonferroni correction (Wald Χ2 (1) = 5.04, p = . 025, B = −0.52, CI = − 0.97 to − 0.07). These results indicate that IG perceived food as less palatable after the treatment as compared to CG.
Concerning the wanting of food stimuli, there was a significant time effect (overall Wald Χ2 (2) = 31.99, p Wald Χ2 (1) = 16.57, p Wald Χ2 (1) = 17.90, p Wald Χ2 (1) = 8.96, p = 0.003, B = − 0.71, CI = − 1.18 to − 0.25) and at T2 (Wald Χ2 (1) = 7.04, p = 0.008, B = − 0.77, CI = − 1.34 to − 0.20). This indicates that both groups experienced reduced wanting over time. Additionally, a group difference at T0 elapsed (Wald Χ2 (1) = 4.90, p = 0.027, B = − 1.32, CI = − 2.49 to − 0.15), indicating that CG displayed comparably less desire to eat the presented food stimuli as compared to IG already at the beginning of the study. However, this group difference was not significant after Bonferroni correction.
Concerning patients’ liking of food stimuli, there was also a significant time effect indicating a reduction of liking (overall Wald Χ2 (2) = 10.49, p = 0.005), but this effect only reached significance in IG (T1: Wald Χ2 (1) = 7.89, p = 0.005, B = − 0.47, CI = − 0.79 to − 0.14; T2: Wald Χ2 (1) = 9.86, p = 0.002, B = − 0.48, CI = − 0.78 to − 0.18), and not in CG (T1: Wald Χ2 (1) = 2.85, p = 0.092; T2: Wald Χ2 (1) = 1.61, p = 0.205).
Concerning the neutral stimuli, no significant main effects or interactions emerged, besides one time effect in CG from T1 in comparison to T0 (Wald Χ2 (1) = 9.72, p = 0.002, B = 0.078, CI = 0.029 to 0.127), which is indicating of a small increase of pleasantness in CG after the treatment period. Overall, the neutral stimuli were perceived by both groups as neutral.
Correlational analyses
Correlational data is presented as a supplement in Table S1. After Bonferroni correction, the pooled initial fixation position and second saccade errors on food stimuli over both groups and all measurement points did not correlate significantly with eating disorder pathology, BMI, trait impulsivity and stimulus ratings (all p > 0.00125). The dwell time on food stimuli correlated significantly with all stimulus ratings concerning food stimuli (pleasantness r = 0.33, palatability r = 0.36, wanting r = 0.45, liking r = 0.37), and FCQ-S total score (r = 0.35), each p r = 0.29, p r = 0.31, p
Sensitivity analyses
As there was a nearly significant group difference of FCQ-S total score at baseline and as FCQ-S total score correlates with dwell time and first saccade errors, we computed sensitivity analyses where we included FCQ-S total score as a covariate into the GEEs. Concerning dwell time, FCQ-S total score was not significant (p = 0.529), but the group x time x stimulus interaction stayed significant with p = 0.016. Concerning first saccade errors, FCQ-S total score was also not a significant covariate (p = 0.104) and the reported time effect stayed significant (p = 0.005).

