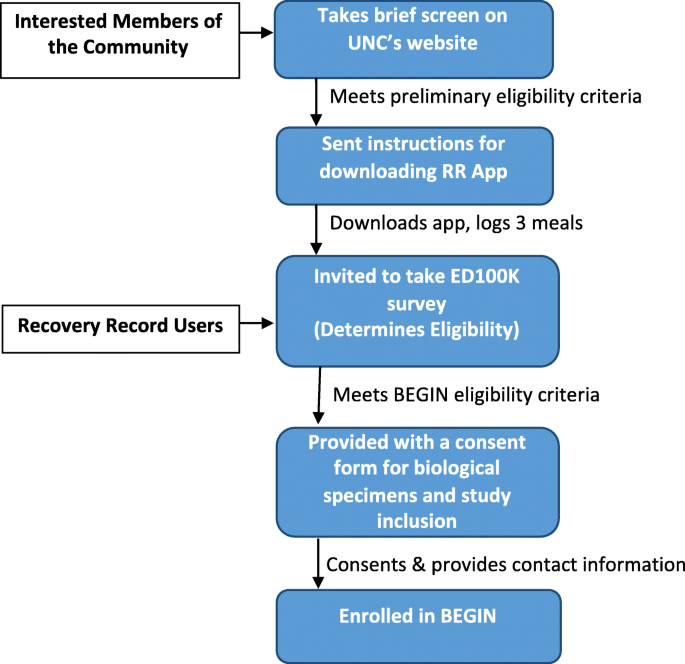
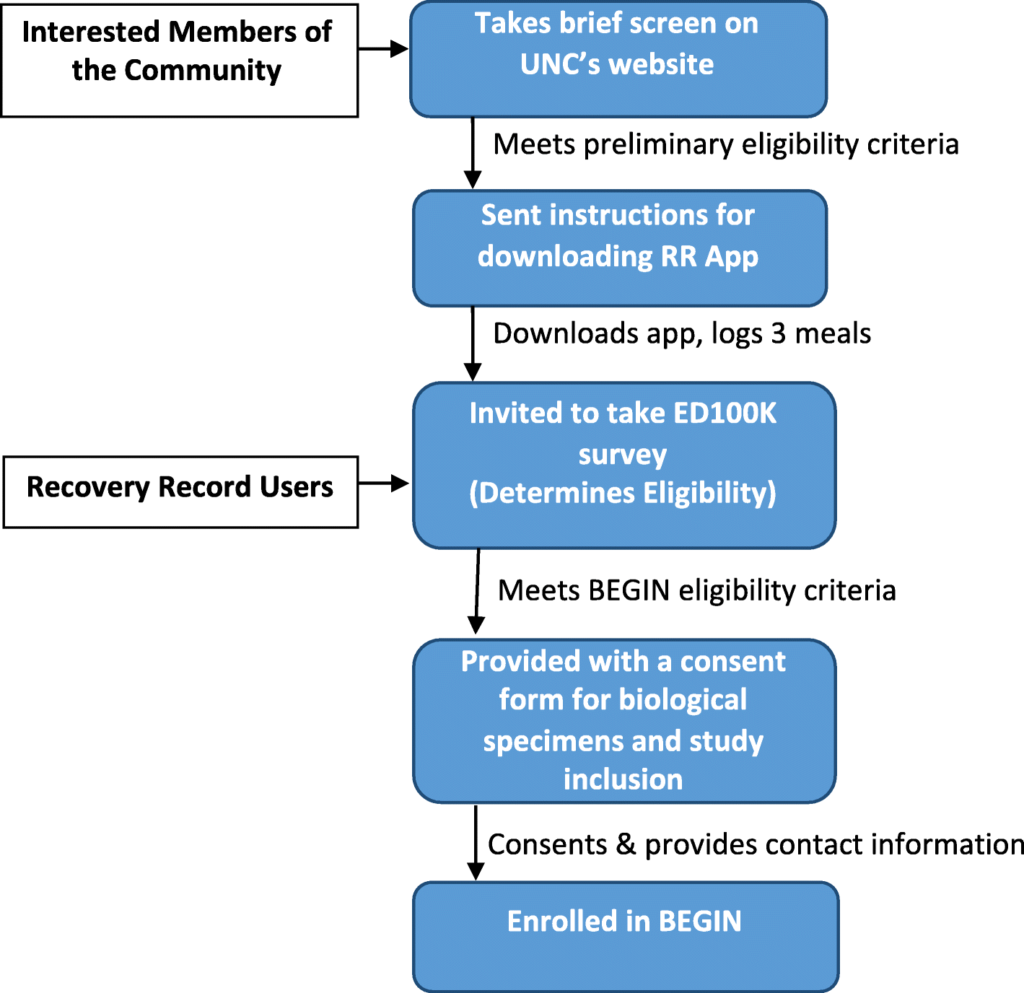
We are recruiting cases nationally from diverse geographical, socioeconomic, racial, and ethnic backgrounds via Recovery Record, social media and National Eating Disorders Association. Specifically, we launch tweets and Facebook posts that direct potential participants to the BEGIN url https://www.med.unc.edu/psych/eatingdisorders/research/participate-in-a-study/begin-study/ where they can take a preliminary screen. In addition, Recovery Record pushes notifications about BEGIN to users. Recruitment flow is detailed in Fig. 1.
Fig. 1
BEGIN study recruitment and sampling flow
Procedure
Informed consent is obtained digitally via the Recovery Record app. Participants complete an eating disorders diagnostic questionnaire. Those who screen case positive and meet all inclusion criteria are offered the opportunity to participate in the full study (with a second digital informed consent). All responses to questionnaires are encrypted and sent to a secure research server at the UNC Sheps Center for Health Services Research using secure transfer methodologies, who compile and house the data in servers specifically designed for Protected Health Information. Data are de-identified (Sheps Center maintains the key to match records). Study data from Recovery Record and the Apple Watch are maintained by Recovery Record and only includes passive and active sources necessary for analyses, minimizing exposure of protected health information. To ensure that a high level of security is maintained, data transfer from Recovery Record occurs with end-to-end encryption and authentication protocols. Records are only identified with a second study number that can be linked using the data from the Sheps Center. Eligible participants are mailed a package containing a description of the study, saliva collection kit, microbiome collection kit, and an Apple Watch. Saliva kits are returned directly to RUCDR Infinite Biologics where they are stored awaiting DNA extraction and genotyping. In Phase 1, participants returned microbiome kits to uBiome for sequencing; in Phase 2, kits are returned to the Carroll lab. Barcodes ensure accurate identification and coordination with phenotypic data. After enrollment and completion of the baseline survey, participants use the Apple Watches and Recovery Record for 30 days and complete midpoint and end-of-study surveys at 14 days and 30 days post-enrollment, respectively, to track progress of eating disorder pathology, including binge eating and purging behaviors.
Measures
Deep Phenotyping
Using the Recovery Record app and the Apple Watch over a 30-day period for each individual, we conduct active and passive data capture to fully characterize disordered eating behaviors, physical activity, nutrition, gastrointestinal distress, sleep, and heart rate. This generates exceptional data to enable deep characterization of the course of BN/BED. We expect that the likelihood of an event (i.e., binge/purge) will decrease over the course of 30-days and build this expectation into our statistical models. We further expect that although the likelihood of events will change over time, the dynamics of the events will not. These data can be broken down into four categories. First, self-report questionnaires are collected consisting of scales well established to relate to BN and BED (see Self-report questionnaires), measured prior to enrollment or three times across the study. Second, stratified sample intensive measurements consisting of daily mood and meal records are measured 6 times daily. Third, event contingent intensive measurements ask participants to log binge and purge episodes. Finally, continuous passive data collection captures real-time physiological and movement data. These different data will be integrated through multilevel modeling and systems continuous time modeling procedures [28, 29].
Active data collection
Self-report questionnaires
All BEGIN study participants are screened for eligibility and consented using the Recovery Record iPhone app, which is free for users to download and is HIPAA compliant (www.recoveryrecord.com). All questionnaires are completed from within the Recovery Record app.
ED100K [30]
The ED100K questionnaire is a self-report, eating disorders assessment based on the Structured Clinical Interview for DSM-5, Eating Disorders Module, administered prior to enrollment. Items assess DSM-5 criteria for anorexia nervosa, BN, BED, and other specified feeding and eating disorders. The ED100K-v1 was found to be a valid measure of eating disorders and behaviors [30]. Positive predictive values indicating that among those who had a positive screening test, anorexia nervosa Criterion B, Criterion C, and binge eating ranged from 88 to 100%. Among women who had a negative screen, the probability of not having these criteria or behaviors ranged from 72 to 100%. The correlation between questionnaire and interview for lowest illness-related BMI was r = 0.91.
Eating disorders examination questionnaire (EDE-Q) [31]
The EDE-Q is a widely used, validated questionnaire capturing eating disorders pathology, including the frequency and severity of binge episodes. The EDE-Q is administered at baseline, midpoint, and endpoint of the 30-day period.
The Patient Health Questionnaire (PHQ-9) [32]
Is a 9-item, self-administered version of the PRIME-MD diagnostic instrument for common mental disorders. The nine items are based on the nine DSM-IV criteria for major depressive disorder and are scored as “0” (not at all) to “3” (nearly every day). The PHQ-9 has been found to be a reliable and valid measure of depression severity. The PHQ-9 is administered at baseline, midpoint, and endpoint of the 30-day period.
The Generalized Anxiety Disorder 7 (GAD-7) [33]
Is a 7-item, self-report questionnaire to screen for generalized anxiety disorder. Each symptom is scored on a 3-point scale: “not at all” (0), “several days” (1), or “more than half the days” (2). Items are then summed to create a symptom severity score. The GAD-7 is a reliable and valid measure of anxiety. The GAD-7 is administered at baseline, midpoint, and endpoint of the 30-day period.
ADHD self-report scale (ASRS) [34]
Is an 18-item questionnaire that assess symptoms associated with attention-deficit/hyperactivity disorder. Items are scored on a 5-point scale. The assessment has high internal consistency and validity [35]. The ASRS is administered at baseline.
Rome III [36]
To assess adult GI symptoms of the stomach and intestines, the relevant section (items 17–67) of the ROME III is administered at baseline.
Stratified sampled intensive measurements
Daily mood and meal records
These data are collected inside the Recovery Record iPhone app that primarily targets adherence to meal monitoring tasks. Participants are prompted with a push notification six times per day corresponding to meal and snack times to complete an evidence-based CBT-style question set (what was eaten, with whom, where, and what behaviors were used) in addition to optional symptom-focused questions including current emotional state, urges to engage in eating disorder behaviors, sleeping patterns, hunger levels, gastrointestinal problems, and intrusive thoughts.
Event contingent intensive measurements
Binge and purge records
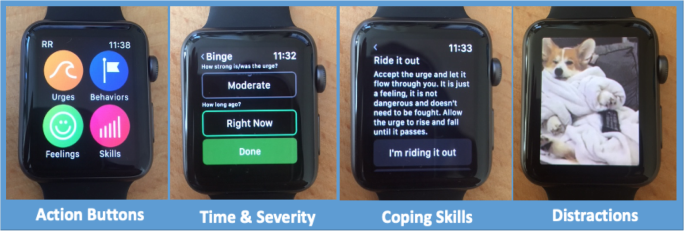
Participants are instructed to launch the Recovery Record Apple Watch app if they have experienced a binge or purge episode (Fig. 2). Action buttons are used to quickly identify the relevant symptom and how long ago it occurred, with response options in five-minute increments ranging from “Right now” to “30 mins ago”. If an urge to engage in a behavior is identified, participants are additionally asked to rate the urge strength with response options: “Not at all”, “Slight”, “Moderate”, “Strong”, and “Overbearing”. Actively monitored mood, meal, binge and purge records and their respective timestamps are collected on the Recovery Record platform and shared with the research team via encrypted authenticated TLS. Ecological momentary assessment-based logging has shown moderate to strong concordance with retrospective self-report of binge eating and purging [37].
Fig. 2
Recovery Record for Apple Watch screen examples. Image Action Buttons include icons created and owned by Recovery Record, Inc. (J. Tregarthen, author, CEO). Image Distractions features Relaxed Corgi GIF uploaded by GIPHY, 27 June 2016, https://giphy.com/gifs/7Y66VN3rtkPtu. These images were made available for the purpose of this research per our subcontract agreement with Recovery Record, Inc. (J. Tregarthen, Principal Investigator and author). The image titled Distractions features Relaxed Corgi GIF uploaded by GIPHY, 27 June. 2016, https://giphy.com/gifs/7Y66VN3rtkPtu. The GIF was accessed utilizing the Recovery Record, Inc. GIPHY account and made available under a license agreement between Recovery Record, Inc. and GIPHY
Continuous passive data collection
Apple watch
The number and timing of the steps (physical activity) as well as 5-min epoch heart rate are passively collected for each study participant using the Apple Watch and harvested by the Recovery Record app using Apple’s Application Program Interface (API). The Apple Watch activates the sensor approximately every 5 min to record heart rate based on 100 Hz using photo plethysmography. Built in signal processing algorithms are used to aggregate measurements to approximately 5-min intervals, a rate consistent with current methodological guidelines (e.g., Berntson [38]). To minimize data loss, these variables are uploaded to the Recovery Record server each time the Recovery Record app is opened on the iPhone while the Apple Watch is nearby, or at least once per day.
Biological sampling
Saliva sampling and genotyping
Saliva samples are collected with RUCDR Infinite Biologics saliva collection kits. GWAS profiling will be performed together with additional samples collected by the PGC-ED using the optimal platform at the time of genotyping, most likely a version of the Illumina Global Screening Array (GSA).
Fecal sampling and sequencing
In Phase 1, as recipients of a scientific in-kind grant from the now defunct company uBiome, we collected stool samples. uBiome comprehensively characterized the biogeography of the human microbiome using high-throughput sequencing of the microbial 16S rRNA gene and released all data to UNC for analysis. After their company dissolved in Oct 2019, all processing transferred to the Carroll Lab at UNC (I. Carroll, Director). In order to obtain high-resolution taxonomic and functional microbiome data, we will perform whole genome shotgun sequencing. Raw sequence data will be quality filtered and trimmed to remove bases with Phred quality scores less than 20. Downstream bioinformatics analysis will consist of: i) taxonomic composition; ii) functional composition; iii) alpha diversity (as measured by absolute numbers of sequence variants and the Shannon index of diversity) and (quantified by Bray Curtis and UniFrac metrics); and iv) computing descriptive statistics and identifying groups within the data, as well as performing statistical analyses between subgroups using additional metadata, where available [39]. Since the sequencing technology and bioinformatics tools are rapidly advancing, we will utilize the most suitable methods and tools available at the time of analysis.
Planned data analysis
Genomics and microbiota aims
We will combine BEGIN samples with other samples in the PGC-ED for meta-analysis. We will conduct cross-disorder analyses to identify loci that cut across diagnostic categories by leveraging existing high-quality results for anorexia nervosa, major depressive disorder, schizophrenia, bipolar disorder, and other psychiatric and metabolic phenotypes. We will use advanced methods [40] to compute SNP heritabilities and genetic correlations across psychiatric and metabolic traits. We will calculate metabolic and psychiatric trait & disorder polygenic scores (PGS) using PRSice, (http://www.prsice.info). A leave-one-sample-out process will be carried out to calculate BN/BED PGSs. The calculated PGS will be the weighted numbers of risk alleles carried by each case and control. This aim will illuminate, from a fundamental perspective, the genetic architecture of BN/BED and its relation to other psychiatric disorders and metabolic conditions.
We will compare taxonomic composition and diversity of the gut microbiota for BEGIN participants, compare BN with BED, and both to a reference control panel. We will control for multiple covariates in all analyses (e.g., obesity).
We can now rapidly do GWAS on multiple phenotypes – e.g., GWAS for 22 K transcriptomic, 8 K proteomic, or 1 K metabolomic measures. (1) We will adapt and extend these methods to evaluate host genomic-microbiota interactions by conducting ~ 15 K GWAS for species-level microbial measures while controlling for multiple comparisons. (2) We will generate microbiome “modules”, clusters of species with high intra-group correlations and low inter-group correlations. We will then do a GWAS for these modules. (3) For all analyses, we will pay particular attention to the genomic regions highlighted in the prior literature (e.g., MHC, autoimmunity, gut barrier, inflammatory bowel disease). (4) We will utilize publicly available databases of summary statistics across a range of psychiatric, personality, metabolic, and physical activity phenotypes and employ both trait-specific polygenic scores (PGS) and multi-polygenic scores (MPS) to predict outcomes. We will use a novel MPS approach developed by collaborator Breen and colleagues [41], that exploits genetic correlations between the outcome trait and a multitude of traits by using the joint predictive power of multiple polygenic scores in one regression model. We will select relevant GWAS from a centralized repository of summary statistics to predict BN, BED, severity, treatment outcome. Using repeated cross-validation, we will train and validate the prediction models using elastic net regularized regression, which is a multiple regression model suited to deal with a large number of correlated predictors while preventing overfitting [42]. We will then add microbiota and phenotyping variables into the model to improve predictive accuracy.
Digital longitudinal phenotyping aims
Our dynamic systems approach capitalizes on a combination of the passive and active data collection to address all three of the longitudinal phenotyping aims. Each stable state can be thought of as having homeostatic properties that are reflected in associations between different levels of derivatives (i.e., change in value with respect to time). For example, the relationship between changes in heart rate from one moment to the next and values of heart rate at the previous moment characterize how heart rate fluctuates homeostatically about a “set point.” This set point represents the heart rate value to which the individual’s body returns when the person is at rest [43]. Not only does this association characterize the homeostatic heart rate value itself but also the rate of return to the set point when a person’s heart rate is perturbed (i.e., experiencing distress prior to a binge/purge episode, physical load creating during exercise, etc.). Higher order derivatives and accounting for more variables simultaneously allows for testing more complex homeostatic patterns (e.g., cycles), while including this concept of rate of return to set point (i.e., systemic stability).
Aim 2 will be tested by first depicting the dynamics that lead up to a binge or purge event in a multilevel model. Aim 3 will be addressed by depicting the dynamics once a binge or purge event has occurred. In this case, analyses will focus on the 2 h after binge/purge events (but not within an hour of a future event), again modeling changes in heart rate and steps as a function of current levels in heart rate and steps. Aim 4 will require depicting each instance in time in terms of risk for being in one of the temporal states associated with subsequent binge eating and/or purging. To do so, we will utilize the posterior probabilities from a latent mixture model where each pattern is differentiated by associations amongst different levels of change. Mixture modeling is a taxonomic approach where timepoints within and between individuals can be grouped together as a function of a model. In this case, the model will differentiate groups of data as a function of the dynamic properties.
To help ensure reproducibility, the sample will be split in half with each half used as confirmation on the other half generating competing models. Under large data circumstances such as these, rather than power, the primary concern is a combination of overfitting and gaining a proper gauge of an effect. Generating competing models allows each of the samples to function as confirmation of the other with the better fitting model on both samples providing the more generalizable solution.

