We investigated whether four inbred strains of female mice showed differences with respect to the ingestion of chow or HCD under constant or intermittent access conditions, with the intermittent exposure paradigm diagramed in Fig. 1. Food intake for each individual strain during this paradigm is presented in Fig. 1I–L, with each intermittent HCD exposure period demarked by arrows, on days 3 and 10. Data from the second intermittent exposure period, at day 10, were used for analysis. While the S1, NOD and B6 strains all showed similar levels of chow and HCD consumption, A/J female mice showed an elevation in intake relative to the other mouse strains (Fig. 2A, 2-way ANOVA, effect of genotype, F3,21 = 6.762, p = 0.0023, effect of time, F6.5,135.6 = 2.176, p = 0.0446 interaction of genotype x time, F36,252 = 1.342, p = 0.1021, Table 1 reports the multiple comparisons between genotypes) and also exhibited an increase in HCD intake (Fig. 2B, 2-way ANOVA, effect of genotype, F3,19 = 4.55, p = 0.0145, effect of time, F3.198,60.77 = 1.545, p = 0.2097, interaction of genotype x time, F33,209 = 0.8011, p = 0.7727, Table 2 reports the multiple comparisons between genotypes). In addition to the elevated intake seen in A/J females, S1 mice showed reduced HCD intake when compared to B6 animals (Table 2). Mice undergoing the intermittent feeding paradigm all showed elevated intake of food during the intermittent exposure to HCD, when compared to daily intake seen in control groups of the same genotype that were either continually fed chow or HCD. (One way ANOVA with p values reported for the ANOVA and for Dunnett’s post hoc test comparing intermittent intake to chow and to HCD intake, Fig. 2D, ANOVA p 2,17 = 19.19, Dunnett’s p 2E, ANOVA p = 0.0002, F2,19 = 13.52, Dunnett’s p = 0.032 (chow), p = 0.001 (HCD), Fig. 2F, ANOVA p 2,15 = 24.21, Dunnett’s p 2G, ANOVA p 2,17 = 51.02, Dunnett’s p
Table 1 Statistical table describing the 2-way ANOVA output and the multiple comparisons made in Fig. 1, panel A, between mouse strains during chow food intake.Table 2 Statistical table describing the 2-way ANOVA output and the multiple comparisons made in Fig. 1, panel B, between mouse strains during HCD intake.
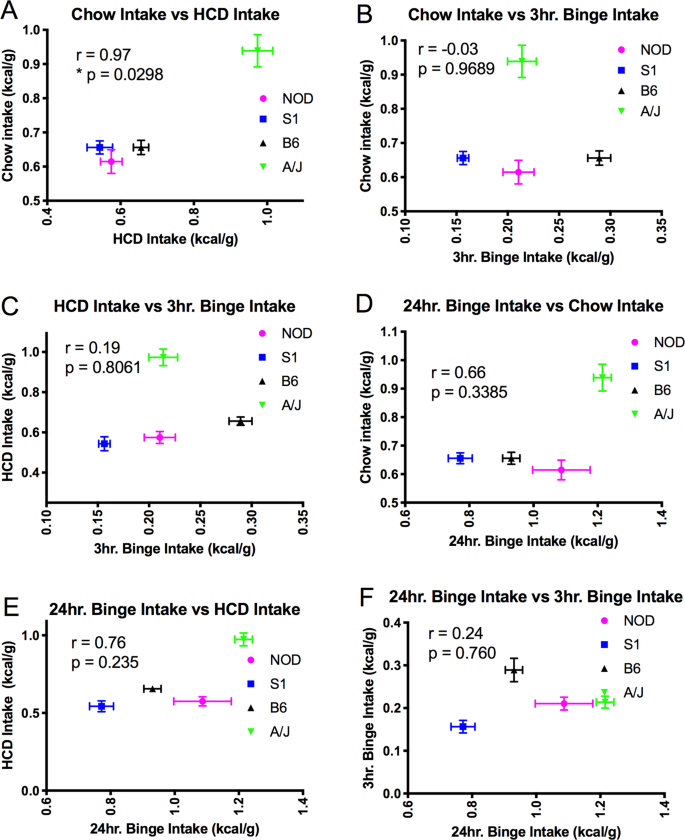
Interestingly, when mouse strains had intermittent access to HCD, the resulting binge-like, elevated intake of HCD did not occur to the same extent across all strains (Fig. 2H). While all inbred strains showed an average intake during the 3 hour binge-like feeding episode that was less than that of the B6 strain, the S1 animals consumed less than all other strains, showing a significant reduction in binge-like food intake (Fig. 2H, ANOVA, F3,25 = 25.05, p 3). These data suggest that genetic variation between the strains significantly affects binge feeding behavior. We then wanted to determine whether the regulation of ad libitum food intake in these inbred strains correlated with intermittent food intake, as prior studies suggest that the neuronal mechanisms that regulate food intake differ between these two behavioral paradigms9. As expected, intake in the ad libitum fed chow and HCD groups was highly correlated (Fig. 3A, r = 0.97, p = 0.0298, suggesting that similar neuronal systems may be involved in determining intake based on the caloric content of food. However, neither HCD nor chow intake correlated with the food intake of intermittent HCD exposed animals, either at 3 hr (Fig. 3B r = −0.03, p = 0.969, Fig. 3C r = 0.19, p = 0.806) or 24 hr (Fig. 3D r = 0.3385, p = 0.338, Fig. 3E r = 0.235, p = 0.235) time points. Thus, our work suggests that binge food intake and the regulation of food intake based on caloric value may be regulated by separate mechanisms that are affected by the genetic variation observed between the S1, NOD, B6 and AJ inbred mouse strains.
Table 3 Statistical table describing the multiple comparisons made (1-way ANOVA, Tukey’s post hoc test) in Fig. 1, panel H, between mouse strains during the 3 hr intermittent exposure to HCD.Figure 3
(A) Chow food intake and HCD diet intake show high levels of correlation across mouse strains (r = 0.97, p = 0.298) Binge food intake shows little correlation with chow intake (B,D) or with HCD intake (C,E). Acute versus chronic feeding in the intermittent exposure to HCD group also shows little correlation across mouse strains (F).
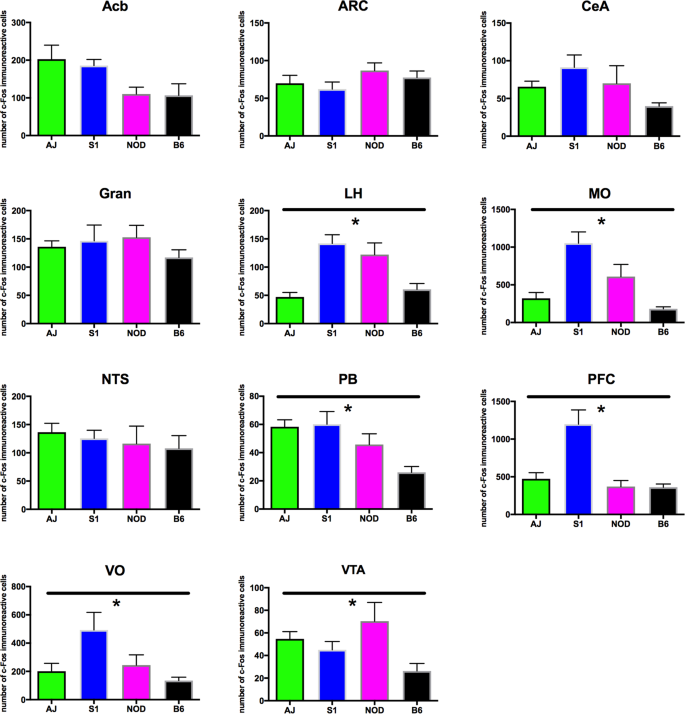
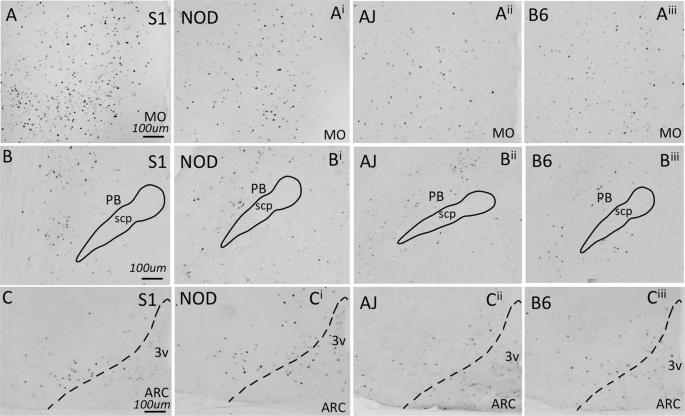
To begin to characterize whether neuronal activation within brain regions shown to regulate feeding is dependent upon strain genotype, we examined c-Fos expression following the ingestion of a small quantity (0.1 g) of HCD in naïve animals. Several brain areas exhibited genotype-dependent expression of c-Fos. The lateral hypothalamus (ANOVA, F3,24 = 13.55, p = 1.23 × 10⁻⁴), medial- (ANOVA, F3,23 = 14.46, p = 1.23 × 10⁻⁴) and ventral orbitofrontal cortices (ANOVA, F3,23 = 4.028, p = 0.0379), medial prefrontal cortex (ANOVA, F3,25 = 11.75, p = 1.98 × 10⁻⁴), ventral tegmental area (ANOVA, F3,22 = 3.992, p = 0.0379), and parabrachial nucleus (ANOVA, F3,23 = 6.856, p = 0.00502) all showed significant differences in c-Fos expression across genotype (Fig. 4). However, several other brain areas that have been demonstrated to regulate food intake exhibited no differences in c-Fos expression across the genotypes tested (Fig. 4): the arcuate nucleus (ANOVA, F3,25 = 1.017, p = 0.468), nucleus accumbens (ANOVA, F3,24 = 2.978, p = 0.07189) central nucleus of the amygdala (ANOVA, F3,25 = 2.947, p = 0.07189), granular cortex (ANOVA, F3,18 = 0.9769, p = 0.468) and caudal nucleus of the solitary tract (ANOVA, F3,25 = 0.3978, p = 0.756). Differences in c-Fos expression can be readily observed in images presented from the S1, NOD, AJ and B6 strains, of sections from medial orbitofrontal cortex and parabrachial nucleus (Fig. 5A,B). Little difference in expression can be seen across genotype within the arcuate nucleus (Fig. 5C). Finally, we looked at whether differences in cFos expression in select brain nuclei correlated with variation in 3 hr. binge-like food intake observed between the four inbred mouse strains. As we describe in Table 4, however, no significant correlations were observed.
Figure 4
cFos expression in response to HCD feeding. Animals were fed 0.1 g HCD 90 minutes prior to sacrifice, with all animals consuming the test diet. cFos expression was then determined in brain areas shown previously to regulate food intake behavior. While cFos expression does not show variation between mouse strains in select brain nuclei (A, Acb, B, Arc, C, CeA, D, Gran and G, NTS). cFos expression in the LH (E), MO (F), PB (H), PFC (I), VO (J), VTA (K) all exhibited genotype dependent differences (ANOVA, p
Figure 5
Examples of cFos expressing brain areas from all four mouse strains challenged with HCD, as quantified in Fig. 3. Increased cFos expression was observed in the MO (A) and PB (B) across mouse lines, while little change in cFos expression was observed in the Arc (C).
Table 4 Correlations between cFos expression in select brain regions and 3 hr. binge-like food intake levels in the inbred mouse strains.
Source link

