Participants and study design
This randomized controlled trial was conducted between 2018 and 2021 in fifteen Portuguese childcare centers. Childcare centers were selected by a statistician using a block size randomization of three, designed to be representative across geographic locations and childcare sizes. Childcare centers were invited to participate in the study. A minimum of 20 children was required as an inclusion criterion, and no additional inclusion criteria were applied to the childcare centers. Children were recruited into the study through childcare centers using a family-oriented process, where parents and children were treated as family units.
The only exclusion criterion was the presence of any disability that prevented children from being assessed. Initially, parental consent was obtained for the child’s participation, followed by securing the child’s assent. The child’s assent was obtained during the assessment, where each child was individually asked about their willingness to participate, and oral assent was obtained.
A total of 344 children were enrolled in the study, 168 males (48.8%) and 176 females (51.2%). The mean age at baseline was 23.6 (6.3) months and 31.3 (6.4) on follow-up.
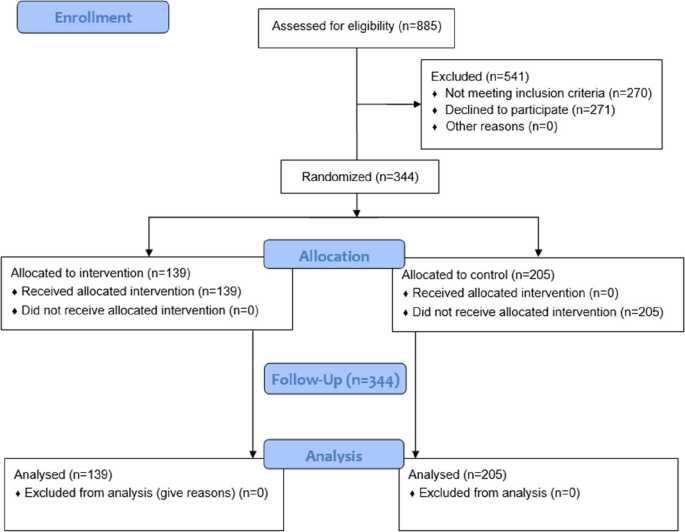
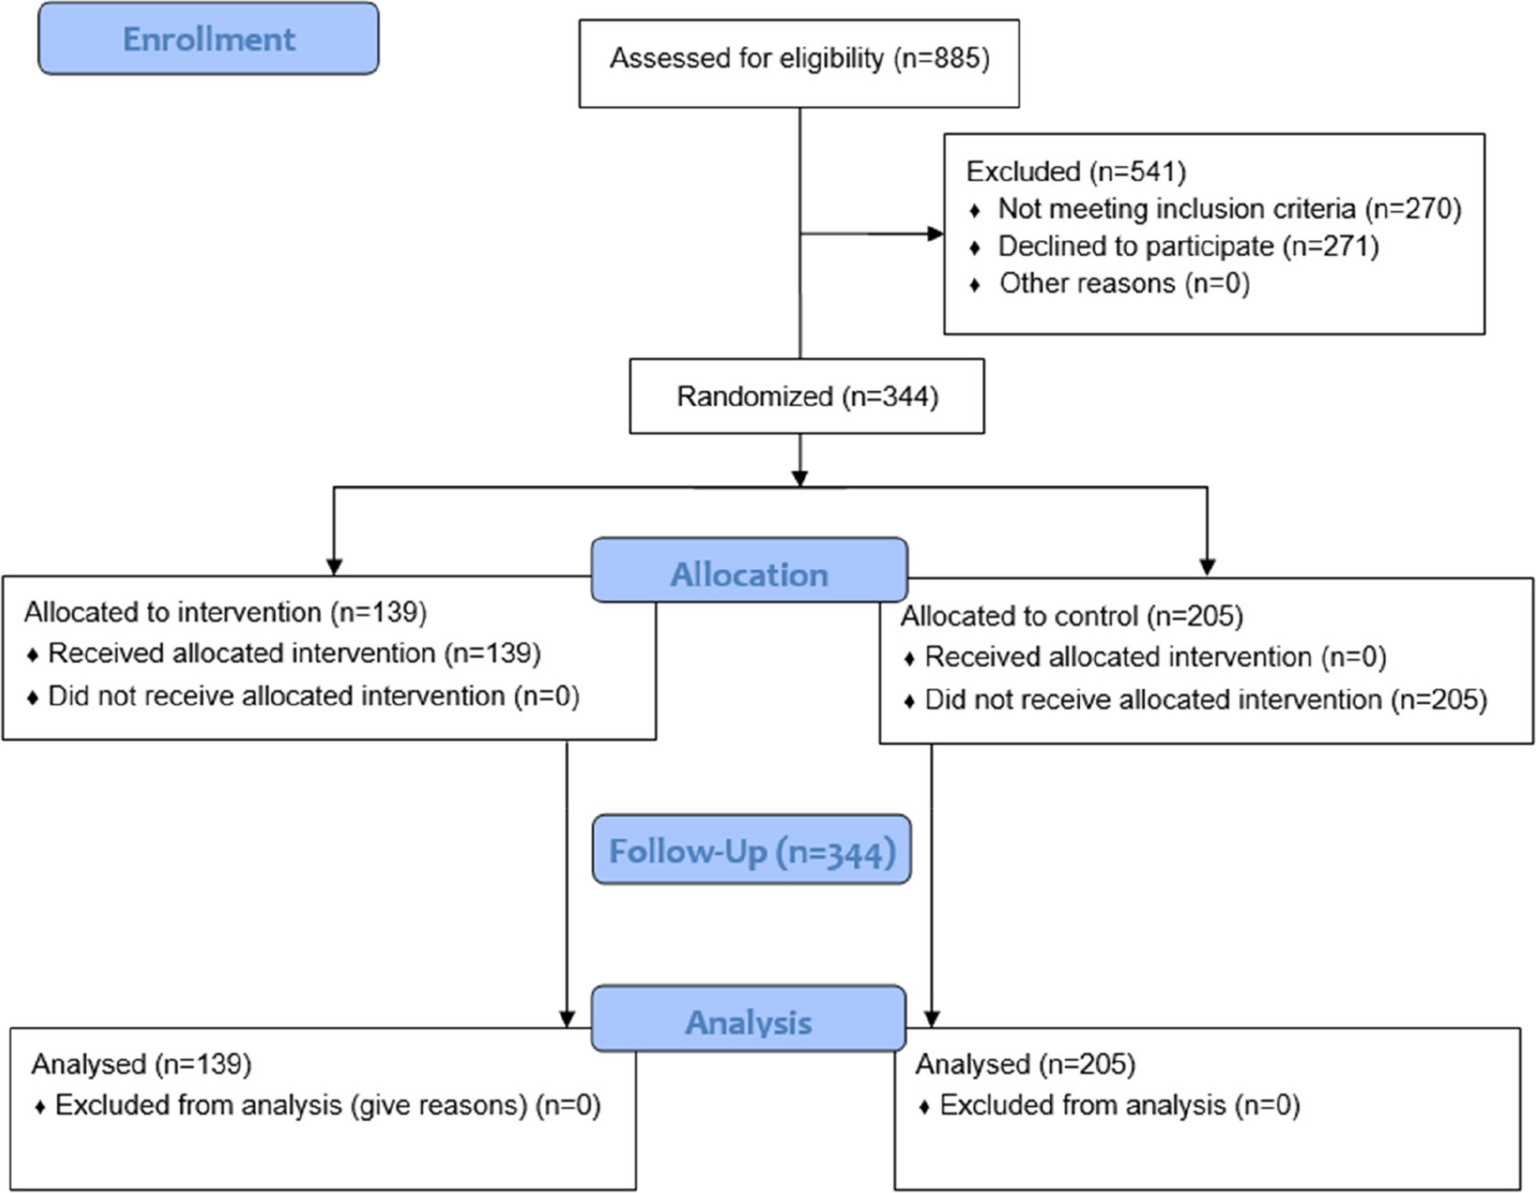
To ensure allocation blinding of childcare centers, randomization was carried out after baseline data collection occurred (which occurred between October to December 2019). The random allocation was performed by an independent statistician. Due to the nature of both groups (intervention and control), clusters and participants were not blinded to their intervention allocation. Blinding was maintained for researchers who undertook follow-up assessments. Block randomization was performed and six childcare centers were allocated to the intervention group, which participated in the intervention program, while the other nine institutions belonged to the control group (Fig. 1 – diagram flow). In the randomization process, we considered variations in childcare center size, ranging from approximately 15 to 45 children. As a result, the control group ended up with a slightly higher number of clusters compared to the intervention group.
Fig. 1
Flow diagram of participants through each stage of the project
The control group didn’t receive any specific intervention during the implementation of the intervention program besides standard education and care. The follow-up assessments were performed between May and June 2020.
Sociodemographic profile
Mother’s education level was assessed at baseline using a question extracted from the Graffar scale [19], adapted to Portugal. This is an international social classification, used as an indicator of the various welfare levels of a social group. It includes 5 criteria: occupation, level of education, sources of family income, housing comfort and appearance of the neighbourhood. Regarding mothers’ education, parents should indicate their last completed academic level. The answers were further transformed into less than higher education (low education) and higher education and more (high education). The assessment of the education level of mothers is a common practice in many studies and allows us to explore a significant variable that may influence child development [17, 20, 21]. Furthermore, an open-ended question was included to allow respondents to express the type of family structure to which they belonged.
Anthropometric measures
At baseline, children’s length and weight were measured at childcare centers by the researchers. While anthropometric measurements were being taken, the children were barefoot and minimally clothed. Weight was measured with a pediatric scale (model SECA 354) and recorded to the nearest 100 g. Children’s length (12–24 months) was measured with the child lying down using an infant stadiometer placed on a flat, stable surface. If the child’s age was less than 2 years old and could stand but refused to lie down, height was measured and added 0.7 cm to convert it into length, according to international guidelines [22]. Height was always measured whether the child was two and more years old.
Body mass index (BMI) was computed as the body weight/height2 (kg/m2) ratio. Each child was classified according to the age- and sex-specific BMI (BMI for age) and BMI standard z-scores following the software Anthro-plus [WHO Anthro-plus software (https://www.who.int/childgrowth/software/en)].
Socio-emotional development
Socio-emotional (SE) development was assessed with the Bayley Scales of Infant and Toddler Development – Third Edition (Bayley-III) [23], which is an adaptation of the Greenspan Social-Emotional Growth Chart [24]. Assessment of SE development occurs at the baseline and after the intervention. Bayley-III is designed for children aged between 1 to 42 months and used as a test of general neurodevelopment [3]. The socio-emotional scale identifies six stages (with substages), with milestones according to the child’s age, and measures behaviors associated with major milestones in functional and emotional development [23]. This is a comprehensive assessment completed by the child’s parent or caregiver, aimed at identifying and evaluating the child’s emotional competencies, including self-regulation, curiosity about the world, effective communication of needs, establishment of relationships, intentional utilization of emotions, and the use of emotional cues to solve problems. Percentiles of socio-emotional development were computed from the raw score and according to the criteria from the original scale [23]. The Cronbach’s alpha of the socio-emotional questionnaire from the original study is 0.90, which indicates a strong internal consistency [23].
Intervention program
The intervention program was co-developed with important stakeholders, such as parents, health professionals, teachers/educators, and bloggers. Two sessions of focus groups with these important authors were carried out in person at the beginning of the trial (March 2019), emerging important topics such as nutrition and movement. In this context, the intervention program addressed topics such as, diet, sleep, physical activity, sedentary behavior, emotional self-regulation and children’s healthy everyday life in the family.
Six childcare centers received the intervention program (a total of 18 childcare teachers, 17 females), conducted between 29th January and 29th April 2020. Due to pandemic constraints, the sessions occurred in a mixed format, three in-person and five in an online format. The online sessions take place through the Colibri-Zoom® platform. Online sessions proceeded as expected, featuring the presentation of topics for each session, activities, and discussions of content, as initially planned in the in-person format. The 3-month training program had a total of 25 h.
The intervention program was approved by the Minister of Education, Scientific-Pedagogic Council for In-service Training (Conselho Científico-Pedagógico da Formação Contínua, Ministério da Educação), in the form of a training workshop.
The intervention program was based on the health promotion model of Nola Pender, which is one of the widely used models to promote healthy behaviors and control unhealthy ones. It is based on social cognitive theory and has core concepts: health promotion; health protection; individual characteristics and experiences; cognition associated with behavior, and health outcomes. The components of Penders’ theory provide a rich source of interventional strategies [25] and support the methodology adopted in the intervention program (i.e. participatory approach).
The intervention program followed two pathways: childcare teachers’ training provided by the research team and the intervention to children (in the classroom or to the family during the childcare closures) provided by the trained childcare teachers. To achieve the goals of the intervention program, each session was drawn to empower educators with creative activities and strategies focused on improving children’s health. The main objective was to empower educators with health promotion strategies and activities for implementation at childcare centers and in children’s homes by families. Some thematic experiences were suggested by the research team. Additionally, the childcare teacher contributed other experiences based on their observations following the implementation with the children. All the children from the intervention group (139 children) had contact with a trained childcare teacher.
The control group didn’t receive any intervention from the research team besides standard education and care. Childcare centers in this group were requested not to start any new health promotion activity initiatives during the 3-month intervention period.
Statistical analysis
Central tendency measures and dispersion were used to obtain descriptive statistics according to the type of variables. Generalized linear models were conducted to examine the associations between socio-emotional status after intervention (outcome) according to the group of schools (i.e., control and intervention). Potential confounders included socio-emotional status before the intervention, demographic factors (e.g., sex, age), and socioeconomic status (mothers’ education).
The sample size was estimated considering the primary outcome of cognitive development as the variable of interest. In previous studies, cognitive development’s average (SD) was 93.3(8.0). To detect a 3% difference in cognitive development between groups (increasing, on average, the score of the cognitive development in the intervention group to 96.0), with errors type I and type II of 5% and 20%, respectively, we should have an effect magnitude of 0.35 and a final sample of 204 (102 for each group). As we randomized at the childcare center level, we considered the effect of design (variance inflation factor) given by the formula 1 + (m-1)*ICC, where m is the cluster size, and ICC is the intra-cluster correlation [26]. Based on previous studies, we considered an ICC of 0.01 [27], obtaining a design effect of 1.17. Knowing that in the city of Braga (where the study occurred), the number of children aged 12 months in each childcare center (cluster) is about 18, we should have a final follow-up sample of 204 children. However, we adjusted our sample size to the potential loss of subjects over the study period, which is usually 28]. Therefore, our final baseline sample should be 300 children belonging to 16 childcare centers (150 children and eight childcare centers per group).
The level of significance was established at 0.05. The data analysis was performed using IBM SPSS, version 27.0.
Ethics approval and consent to participate
The study was approved by the Ethics Subcommittee for Life and Health Sciences of the University of Minho (CE.CVS 133/2018), and all the participants (children’s parents or caregivers) signed the informed consent. At the moment of evaluation, children assent to participate in the procedures. All methods were carried out in accordance with the declaration of Helsinki.
This cluster randomized controlled trial was registered on 09/09/2019 in the Clinical Trials database/platform (number NCT04082247), and CONSORT reporting guidelines were used [29].

